
.svg)

Inventory management software is pivotal in maintaining precise inventory records and gauging the efficiency of your ordering, storage, and shipping processes. The value of your software hinges on the queries you pose. Curious about the duration goods remain in your warehouse before dispatch? Noticed products

.svg)
Inventory management software is pivotal in maintaining precise inventory records and gauging the efficiency of your ordering, storage, and shipping processes. The value of your software hinges on the queries you pose. Curious about the duration goods remain in your warehouse before dispatch? Noticed products disappearing, leading to inventory shrinkage? Or observed erratic shifts in brand popularity, or does demand exhibit a consistent seasonal pattern? Selecting the appropriate key performance indicators (KPIs) is a crucial aspect of warehouse inventory management performance.
Within the realm of inventory metrics, a KPI signifies a quantifiable result linked to specific warehouse operations. For instance, one might assess the accuracy percentage of shipped orders, your inventory turnover ratio, or the percentage of stock in your warehouse that's obsolete or non-functional. Thoughtful selection of KPIs can bolster your company's efficiency and profitability, enhancing customer satisfaction score and reducing inventory-associated costs.
KPIs offer insights that mere inventory level assessments can't. They aid in demand forecasting and other long-term planning facets. Metrics in your inventory management system are instrumental in shaping your forecasts and decisions, allowing you to perceive warehouse performance in percentages rather than sheer numbers. Leveraging KPIs, you can sidestep unforeseen demand surges or bottlenecks.
Inventory management can be gauged based on any element influencing your company's financial health. For instance, metrics like lead time, dwell time, or spoilage rate can be considered. A more nuanced approach to inventory metrics might involve measuring the duration specific items remain on hand. This approach offers more detailed insights than merely tracking inventory levels, paving the way for enhanced operational improvements.
Overloading on KPIs can be counterproductive. It's wiser to pinpoint your challenges or immediate goals and then determine the relevant KPIs. For instance, KPIs can be chosen based on holding costs, safety buffers against inventory value fluctuations, or even specific products prone to demand spikes or spoilage.
There's a plethora of KPIs at your disposal. Some of the prevalent ones align with the overarching goals of businesses. Monitoring these KPIs offers everyone in the company a clearer understanding of prevalent challenges. Beyond these, companies can also craft bespoke metrics to gauge specific areas. Each KPI typically embodies a mathematical formula reflecting the interplay of various factors.
Regardless of the products your company stocks, KPIs are invaluable tools for optimizing fill rates, reducing operating costs, and enhancing warehouse profitability. Top-tier inventory management software provides dashboards to monitor relevant KPIs, ensuring optimal cash flow. Here are some strategies to maximize KPI benefits:
Safety stock level is the additional quantity of an item stored in the inventory as a safeguard against unforeseen situations such as supply delays or unexpected customer demand surges. It's the buffer stock you keep just in case. By maintaining a safety stock, businesses can continue to operate smoothly and cater to customer demands, even if external challenges arise.
Ensuring you have an adequate safety stock is crucial. Without it, there's a risk of running out of essential items, leading to potential sales losses and a negative impact on customer trust. Furthermore, it also provides a cushion against volatile market conditions or supply chain disruptions.
The point at which you should reorder inventory is called the reorder point. This is calculated considering the product's lead time and its average sales velocity. The goal is to replenish the stock just in the nick of time before sales inventory of it depletes.
By adhering to the reorder point, businesses can ensure they always have sufficient stock on hand. This timely replenishment prevents scenarios where products are unavailable, thus maintaining sales and customer satisfaction.
Lead time variability refers to the fluctuations or inconsistencies experienced in the time taken between placing an order for inventory and when it's received. It recognizes that not every order arrives in the exact expected timeframe.
Grasping this concept allows companies to plan better. If there's high variability, it may mean they need to keep a higher safety stock. It aids in mitigating the risks associated with late deliveries from suppliers.
The shrinkage rate is an essential inventory metric, that helps businesses quantify how much inventory they're losing due to factors like theft, damage, or administrative errors.
By keeping an eye on this rate, businesses can identify operational weaknesses and implement strategies to rectify them. Addressing these losses in a timely manner can lead to significant cost savings.
Supplier performance metrics evaluate how well suppliers are meeting business expectations. Key metrics might include the supplier's on-time delivery rate, defect rate, and responsiveness.
By assessing suppliers through these metrics, businesses can ensure they're working with reliable partners. This ensures a consistent flow of high-quality inventory and reduces inventory risk costs potential disruptions in the supply chain.
Every product stored in a warehouse incurs costs, known as holding costs. Simultaneously, inventory carrying cost and the act of ordering inventory comes with its own set of expenses. Both these costs impact the bottom line.
A deep understanding of these variable costs also helps businesses determine the most economical quantity to order. By achieving an equilibrium, they can minimize costs associated with stockouts or overstocking.
The Economic Order Quantity (EOQ) is a model used to identify the ideal order quantity that will minimize total inventory costs, considering both holding inventory carrying costs and ordering costs.
Using the EOQ model ensures that businesses order just the right amount of inventory. This not only leads to efficient ordering but also results in notable cost reductions, making the supply chain leaner.
The inventory carrying rate is a metric that signifies the relative cost of the goods sold and holding inventory. It's usually represented as a percentage, indicating how much it costs to hold an item in stock compared to its value.
By keeping track of cost of goods sold at this rate, businesses can make informed decisions about how much inventory to hold. If the carrying rate is too high, it might be more cost-effective to order in smaller quantities more frequently.
The service level is a metric that shows the likelihood of having stock available when customers demand it. It is often used to balance the cost of carrying excess inventory against the cost of a stockout.
While a higher service level generally leads to higher customer satisfaction, it might also mean higher inventory costs. Hence, businesses need to find an optimal balance to ensure profitability.
Dead stock refers to inventory items that have not moved for a long time and are unlikely to be sold in the future. Slow-moving inventory, on the other hand, sells less frequently but might still hold potential value.
Having too much dead stock or slow-moving inventory ties up capital and warehouse space. Addressing and reducing these stocks can free up valuable resources, improving inventory turnover and cash flow.
Demand forecasting is the act of predicting future sales using historical data, market trends, and demand forecasts and other relevant factors. There are various techniques, ranging from qualitative to quantitative, used to forecast demand.
Correctly predicting future demand ensures businesses stock the right amount of products. This minimizes the risks of overstocking, which ties up capital, or understocking, which can lead to lost sales and dissatisfied customers.Each of these inventory management processes, metrics and strategies plays a critical role in optimizing business operations, ensuring consistent availability of products, and fostering customer trust and satisfaction.
Here are some frequently posed queries about inventory KPIs:
KPI stands for key performance indicators. The inventory accuracy KPI compares automated inventory tracking data with physical counts.
Numerous KPIs pertain to warehouse inventory, each represented by a distinct mathematical equation.
This KPI gauges inventory turnover ratio, the average duration a product unit remains in your warehouse from its arrival to its dispatch.


.webp)
Explore the top 3PL companies in Canada and learn how third-party logistics providers play a vital role in optimizing supply chains. Discover the benefits of partnering with a 3PL, key services offered, and steps to start working with a 3PL in Canada.
.svg)
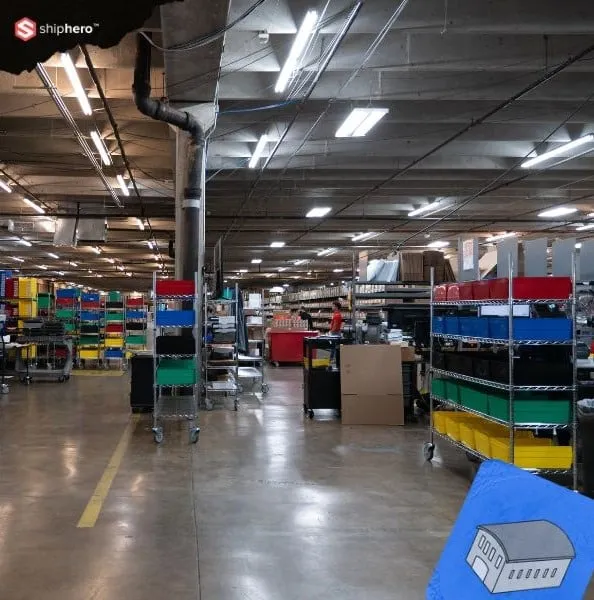
Discover the top 5 best third-party logistics (3PL) companies for your business needs, offering extensive networks, advanced technology, and superior customer service. Learn about the benefits of 3PL services, how to choose the right provider, and avoid common mistakes.
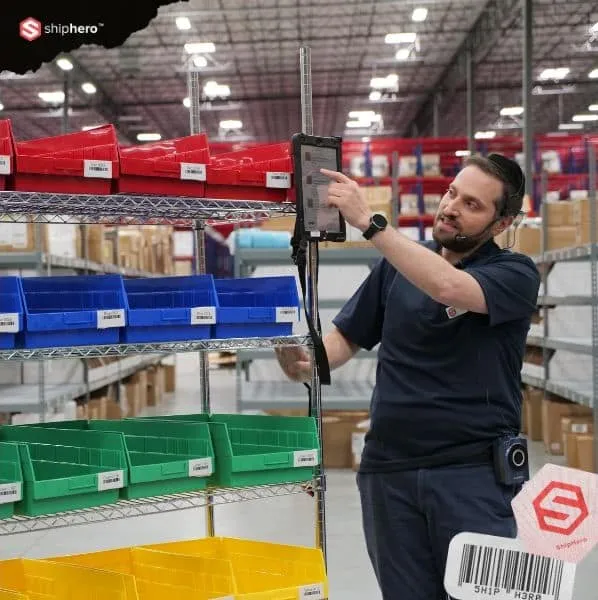
Discover the role, benefits, key features, requirements, and implementation of a 3PL Warehouse Management System (WMS) for optimizing warehouse operations. Learn about scalability, integration, real-time visibility, and customization options to choose the best solution for your business.

At the denser wall, average picking time per order fell from 40 seconds to 13, and orders that ran clean from start to finish rose from 18% to 97%. This is the companion to our Direct Pack + Pack-to-Light case study, from the same research.





.svg)



.webp)